

A local SEO heat map shows how a business’s observed search rankings vary across a set of geographic points. Instead of relying on one search from your office, you can examine where visibility is stronger, where it is weaker, and which areas deserve a closer look.
The colours are useful, but they are only the starting point. Before acting on a local SEO map, check the query, business listing, search surface, collection date, and grid settings behind it.
Quick Answer: A local SEO heat map plots ranking observations at selected locations for a defined keyword and business. Read the legend, inspect individual points, and compare runs with the same settings. Use geographic patterns to guide investigation, not as proof of customer demand, market share, or the cause of a ranking change.
What a local SEO heat map shows
A geographic ranking grid represents searches from multiple selected points. Each marker reports an observation for the chosen query and target business under the tool’s collection conditions. Colour groups make the geographic pattern easier to scan.
For example, BrightLocal describes its Local Search Grid as a way to view keyword rankings at points on a map. This is an example of the reporting approach, not a recommendation that every business needs that particular product.
Check whether your report measures Google Maps, expanded local results, the local pack, or website results. Those positions are not interchangeable. Our local rank checker guide explains how to define a repeatable check before interpreting its output.
A ranking heat map is not a website click map. It also does not show how many potential customers live at each point, how many searches took place there, or how much revenue the area generated.
How to read the grid
Read the report in this order before deciding that a particular colour signals a problem:
- Confirm the target. Check the business listing and branch. Similar names or multiple premises can lead to the wrong target being selected.
- Confirm the query and date. A branded search and a service search answer different questions. An older report describes an earlier collection.
- Read the legend. Establish the rank ranges behind each colour and how the tool displays unavailable or out-of-range results.
- Inspect individual points. Read the reported position and, where available, the businesses appearing alongside your listing.
- Check the geography. Identify the area covered, point spacing, and places that matter to your business.
Do not assume that all providers use the same colour thresholds. A green marker represents the range defined by that report’s legend; it is not a universal measurement standard.
Keep collection failures separate from a business not found within the checked results. If a scan stops at a defined depth, an out-of-range marker does not tell you the business’s exact position beyond that depth.

Choose useful geographic coverage
Set the area around the question you need to answer. A neighbourhood practice may want to understand nearby visibility. A home-service business may need observations across the places its team can realistically reach.
Choose the centre, point spacing, and outer boundary deliberately. Closely spaced points provide more detail within a smaller area. Wider spacing can cover more ground with the same number of points, while leaving larger gaps between observations.
Review points that fall over water, industrial land, or places outside your actual operating area. They may still be valid observations, but they may be less useful for your business decision. Document any exclusions and keep them consistent across comparisons.
Do not move points solely to make the map look better. If you need both a detailed neighbourhood view and a wider service-area view, maintain them as separate reports with clear labels.
For multiple branches, identify which listing each report tracks. A strong result for one branch does not establish visibility for another branch or for the company as a whole.
Interpret common ranking patterns
Stronger near the premises, weaker farther away
This pattern can be consistent with the role of distance. Google’s local ranking guidance describes relevance, distance, and prominence as key factors. However, the map alone cannot tell you how much each factor contributed.
Check whether the weaker points are important to your business before treating them as urgent work. You cannot assume that every business should appear equally strongly across an entire region.
One side of the map is weaker
Inspect the same query at several neighbouring points and review the businesses shown there. Then compare a second collection using the same settings. This helps you establish whether the pattern repeats.
Do not conclude that a road, river, or neighbourhood boundary caused the difference simply because it appears nearby on the map. The pattern identifies a question to investigate, not its answer.
A single isolated point looks unusual
Open that point’s details. Confirm that the target, collection, and result type are correct. Compare it with surrounding points and a later run before making a major website or profile change.
Visibility changes across most of the grid
First check for a changed query, moved grid, different listing, or collection issue. If the runs are comparable, review your website and Business Profile change log alongside the reported results. Timing can support an investigation, but it does not prove that a particular edit caused the movement.
Compare dates without changing the test
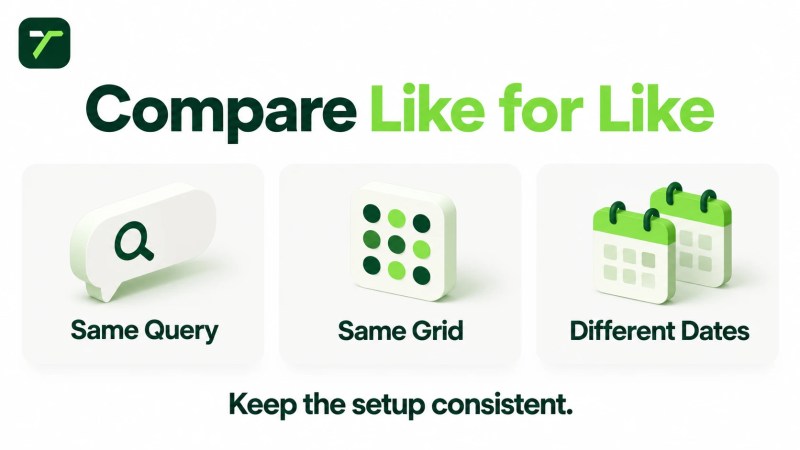
A useful before-and-after comparison keeps the following consistent:
- The exact keyword and target listing.
- The search surface and collection method.
- The grid centre, coordinates, spacing, and included points.
- The result-depth limit and treatment of missing results.
- Other supported settings, such as language and device.
Record the collection dates and compare similar schedules where practical. If a provider changes its methodology or you change the grid, label the change and establish a new baseline rather than presenting the reports as directly equivalent.
In a hypothetical comparison, a business initially tracks its immediate neighbourhood and later expands the grid across the city. Its average could worsen because the new report includes additional distant points. That does not establish a decline at the original locations.
When point-level exports are available, compare the unchanged coordinates separately. Preserve the original reports so another person can follow how the conclusion was reached.
Understand averages and coverage metrics
An average can hide differences within the map. Two reports with similar averages may have very different patterns: one could be fairly consistent, while another combines strong nearby visibility with weak outer points.
Read the provider’s calculation method before comparing its score with another tool. BrightLocal’s average-rank documentation, for example, describes substitute values used for certain non-ranking and not-found markers. A calculated summary can therefore include values that are not observed exact positions.
If you calculate the proportion of checked points within a rank threshold, name it precisely. For a clearly hypothetical example, six of nine valid points appearing in the top three means top-three visibility at six of those nine sampled points. It does not mean two-thirds of local customers saw the business or that it holds two-thirds of the market.
Record the denominator and any unavailable points. Do not silently drop failed collections and then describe the remaining observations as complete coverage.
Turn observations into useful work
Prioritise patterns that repeat in places you genuinely serve and for services you actually offer. Then check the information a searcher would find: the correct business category, service availability, location details, relevant website page, and working contact route.
A weak cluster of points is not an instruction to create a page for every grid marker. Add location content only when it provides genuine information for the reader. Our local landing page guide explains when separate pages are useful.
Compare geographic visibility with contact activity and actual enquiries. Google Business Profile performance reports interactions such as website clicks and call-button clicks. Those measures are different from a sampled ranking map and do not, by themselves, establish completed jobs.
Use our local SEO KPI guide to keep visibility, enquiries, and business outcomes separate. A better-looking map is useful evidence of visibility under comparable conditions, but it is not a substitute for outcome reporting.
A practical review note can stay short: “The same western points remain weaker for our repair query across comparable runs. Check the relevant service page and listing details, then review the next collection.” Record what you actually changed and when.
Frequently asked questions
Is a local SEO heat map the same as a rank checker?
A heat map is a geographic presentation of ranking observations across several points. A rank checker is the broader measurement tool; it may report a single location, a grid, or another format depending on its features.
Does a red point mean the business is not on Google?
No. Read the report’s legend and point details. The colour may represent a lower rank range or a result outside the checked depth. A collection error should be distinguished from an observed ranking result.
How large should the grid be?
Use the area needed to answer your business question. Start with places you can realistically serve, choose spacing that provides useful detail, and keep the configuration stable for comparisons. There is no single grid size that suits every business.
Does a green map guarantee more customers?
No. The map describes visibility for the selected keyword, locations, and collection conditions. Demand, service fit, availability, and the enquiry journey still need to be measured separately.
Use your heat map to choose a focused investigation and a measurable next step. If you need help connecting geographic visibility with your profile, website, and reporting, explore Traffisite’s local SEO services.